Data models are a lot like sellable products: building them is an investment based on the understanding of consumers and working with stakeholders. Data model or product usage can be measured, consumers interviewed, and business benefits evaluated. Typically, there is a selected technical platform and development practices to make structurally similar and manageable products or data models taking into account data governance.

What is a data model
With data modelling, it is possible to reduce duplicate data formatting and maintenance work and make the selected data reliable & easily usable. Typically, a data model for analytics consists of dimensional tables linked to fact tables with keys. Examples of dimensional (dim) tables are customer, product hierarchy or location details. Examples of fact tables are orders and transactions. As an example, a linking key between dim_customer and fact_orders can be dim_customer_key based on a customer number.
Building a data model or a set of data models is a process of:
- First understanding the linking business or process concepts in a company and its functions like customer and orders.
- Second thinking the logical model, for example how business customers and sales orders link to each other by CRM customer number.
- Third implementing a physical data model with tables and linking keys to a data warehouse or lake house.
Here are a couple of good articles about data modelling: What Is a Data Model? (GoodData), Data Model (Wikipedia).
Planning an investment to a data model
The first question to ask in product management is should one make a product or data model in the first place, and with what scope: A) Understand the business needs B) Utilize user statistics C) Study maintenance and data quality benefits vs initial required work.
A) Understand the business needs
Understand the business needs top-down and by role-based interviews for a data product. Typically, a data team gets too narrow view to data modelling by talking to only a selected manager(s) vs talking to both the management and people working in various operative roles in a business. It needs to be understood what reports are used and how, what kind of development projects there are on-going, and what are the business needs in the future. However, the management needs to choose what development has the highest priority and agree with the data team what are the first deliverables.
B) Utilize user statistics
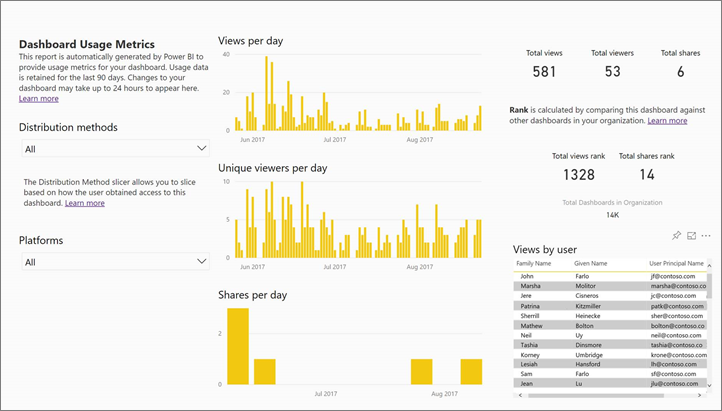
Utilize user statistics and role based usage information from reporting tools like Power BI (link to Microsoft instructions) (Figure 1 below) and data warehouse or lake house.
C) Study the maintenance and data quality benefits vs the initial required work
Data modelling makes the most sense when:
- The same data is needed for multiple reports and analysis ➔ reduced duplication
- The data queries needed for the reports are complex ➔ one place to maintain logic
- There is a need to combine data to other data ➔ easy to link and use
- There is a need for a single source of truth ➔ same figures for everybody and all check the same figures
- The importance of data quality and its monitoring is high ➔ quality monitoring and maintenance is centralized
- There is a need of approachable data for self-service analytics ➔ faster business value delivery
Based on the preliminary work from steps A, B and C, it is possible to start to plan and implement data models based on the holistic understanding what really makes sense for the business and a data team. In addition, as a great bonus from talking to enough users and stakeholders, there comes awareness and involvement to the data modelling work! Furthermore, it is important to write down the plan to e.g. data product canvas (link)). Workshops between business and data professionals are also recommended to facilitate innovation and decision making.
Building managed data models with standard practices
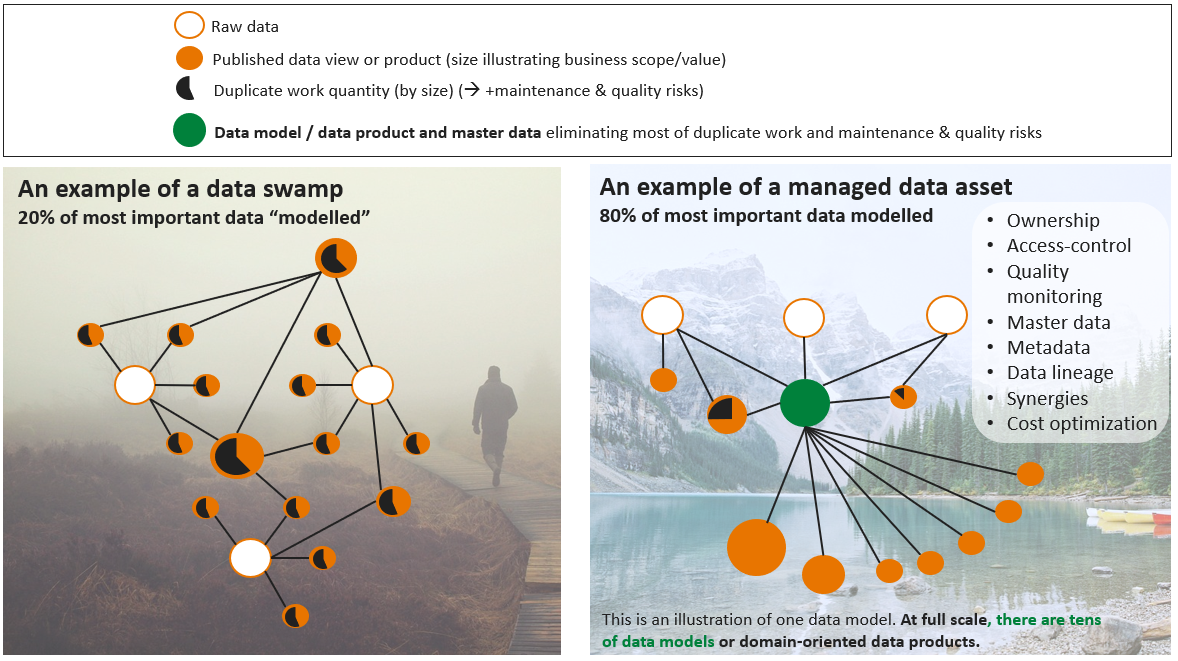
Have a managed data asset instead of a data swamp
It is one thing to make a prototype or case study and another thing to make a long-lasting data product for a company. This is more about the standard ways of working and documentation than it is about a single data model. One could say that a lot of companies are at least partly in a data swamp. What makes a managed data asset different to a data swamp is the taking care of the data governance: ownership, access-control, quality monitoring, master data, metadata, data lineage, synergies, and cost optimization (see Figure 3 below). Furthermore, achieving and running a managed data asset requires standard ways of working and a common operating model both in data engineering and in analytics and data science. Read more about an analytics operating model here: https://plainlyresults.com/blog/operating-model-for-an-analytics-team/ . It really makes sense to have a data catalog to help in the managing and measuring the governance of a data asset. One good alternative is https://datahubproject.io/.
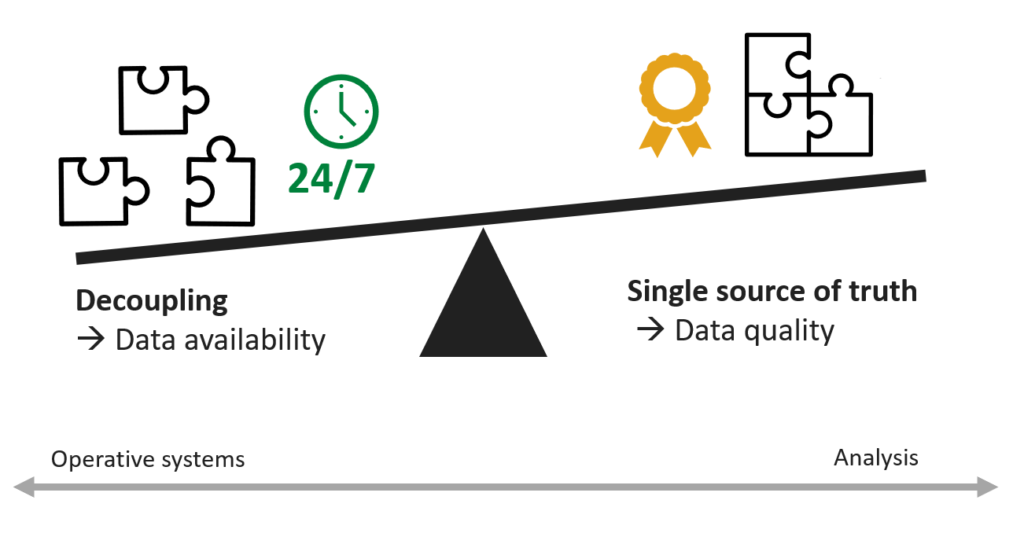
Dependency management and data model landscape
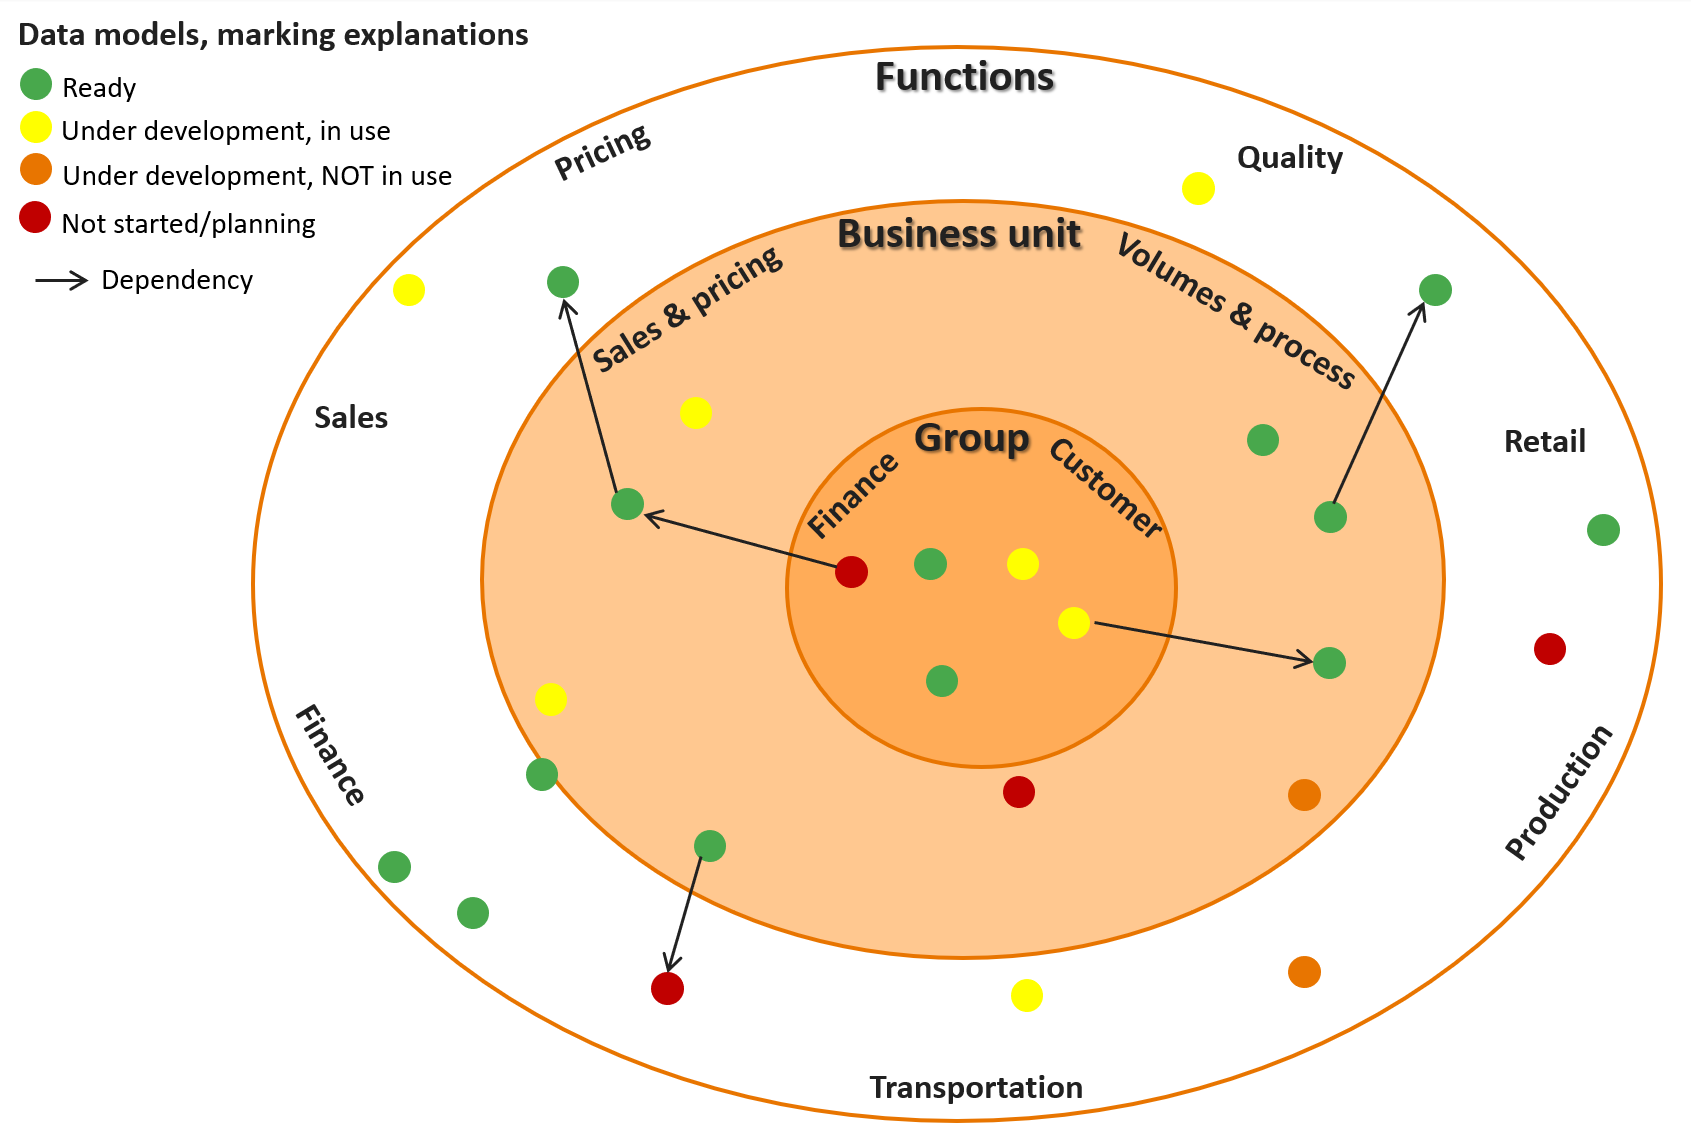
Another key point is dependency management, see Figure 4 below. It makes sense to make data products as modular as possible so that maintenance is simple and responsibilities are clear. A single module only is dependent on the selected and defined inputs. Furthermore, it is important to manage data model landscape, see Figure 5 below. The less there are dependencies, the higher is the availability of the data products and the easier is maintenance. On the other hand, if there are not enough dependences, the single source of truth benefits and data quality monitoring of the data models can suffer as those benefit from unification and more people looking at the same data. For example, in one of my previous jobs, we used partly the same pipelines and golden tables for operative hedging forecasts and sales & marketing data model as this enabled that there were more people checking the same figures and logic than only for a single use case.
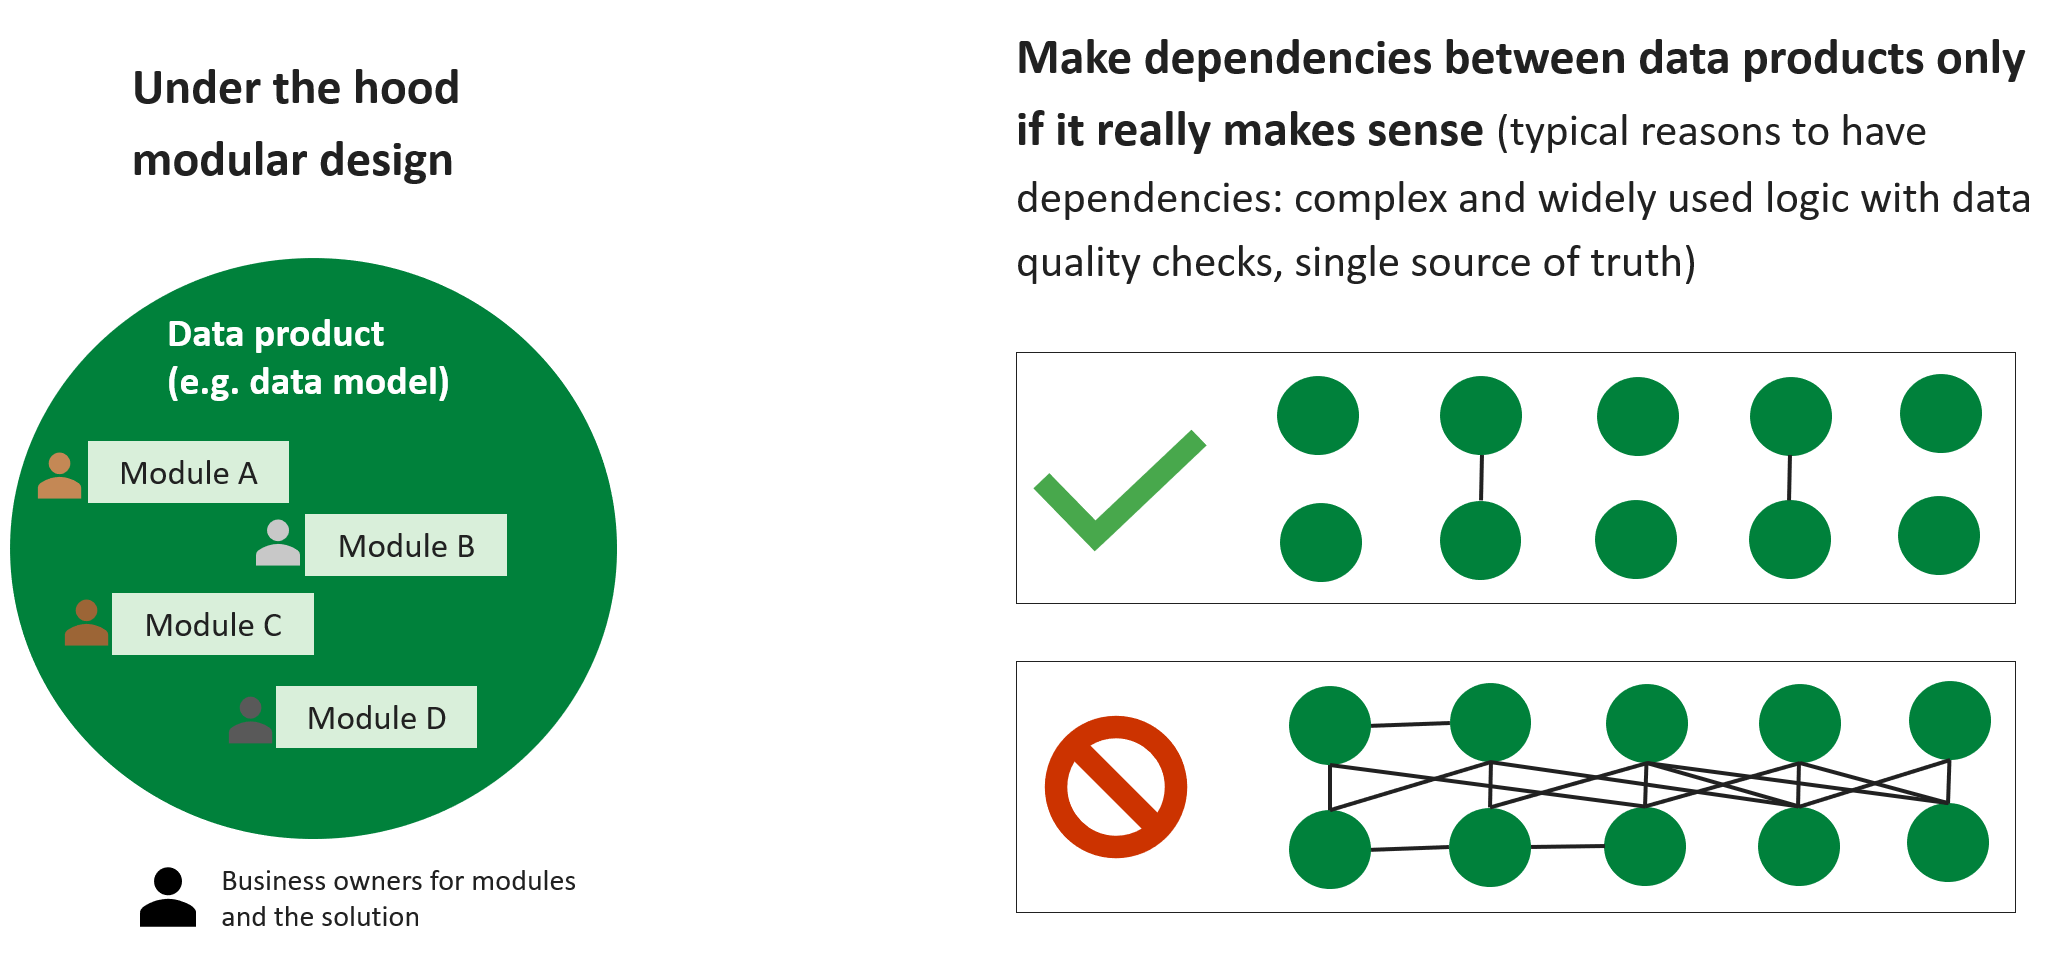
Figure 4. Modular design and data model dependency management.
Measurement of the data model or product performance
There are multiple ways to measure the performance of a product or data model. Here are a couple of key measures to consider:
- Business impact: asking at least on annual basis what kind decisions and automation have been done with a data model and how the data model could be improved to make better decisions.
- User counts and role-based usage via reporting tools or directly via data warehouse or lake house
- User feedback: open or by organized questionnaires to users
- Metrics of a managed data-asset and data governance:
- How many data models do not have an owner in a data catalog
- Is the number of access-control groups (or entities who have access) maintainable per data model
- Rule-based data quality checks and metrics per data model
- When master data was updated last time versus expectation
- Is metadata available and documented
- Is the data lineage of a data model visible and clear in a data catalog? Are the links to other data products documented and manageable?
- Platform cost monitoring: how much a data model causes compute, storage and network costs