The key to drive business with numbers and digitalization is to enable seamless analytics and the excitement of discovery to different analytics user profiles.

I have encountered three key analytics user profiles in business:
- DIY. Create and discover.
- EDIT. Explore and understand.
- ANSWERS. Solutions and clarity.
In this post, I discuss the behavior of these different user groups and how especially a centralized analytics function can serve these different user profiles from the following perspectives:
- Implementation, training and guidelines
- Your behavior
- Documentation
- Tools
DIY user group – the euphoria of discovery
These people are most likely mentally close to you, maybe they are for example analysts. They want to create things and enjoy the euphoria of discovery. The more you let these people to discover the more they will discover and share their discoveries with others too, typically with a lot of excitement. This can make the business more innovation and number driven.
Your role is likely to enable DIY to do what they want. You need to have technical expertise, coaching attitude, and flexibility without forgetting guidelines and review practices. It might be better not to make a complete business analysis and tell how things are but to coach DIY to discover what to do. This is how the business makes a change. Give DIY access to the data and use for example data catalog to build documentation together with DIY.
EDIT user group – the investigators
These people are typically more concerned with the business than the analytics. However, they have a drive to investigate the numbers in detail themselves. One reason is that they might have been earlier in their career in a more analytical role, or their education is quite number driven. Typical examples include controllers, selected marketing professionals, pricing developers, and part of the management in various levels.
Your role is likely to enable the EDIT group to edit some report. This means you build the data model and the basic reporting, and then teach how to edit those basic reports. Furthermore, machine learning is likely to sell here really well, do some quick demos with automated machine learning and continue to more fundamental solutions and business development.
ANSWERS user group – keep it short and clear
These people do not want to make any analytics themselves and want to see results. Some are highly number driven, and some are forced by somebody else. Typical examples include management, sales representatives, and field engineers. It is likely that the requests are either A) really broad and you need to think how to solve them or B) questions are really specific and you need to quickly answer them.
You have both technical and business understanding. You might be a development manager who can utilize a whole team of skill sets or a senior consultant in business intelligence or application development. Keep it clear and short with only the key points visible in the slides and reports you present. Pay attention to the talk and show instead of the perfection of the analysis or slides telling every single detail. This does not mean you do not need to think what you are doing. The key is that you have the skills and knowledge to tell about these details IF ASKED. You might even have a couple of appendix slides or analysis available.
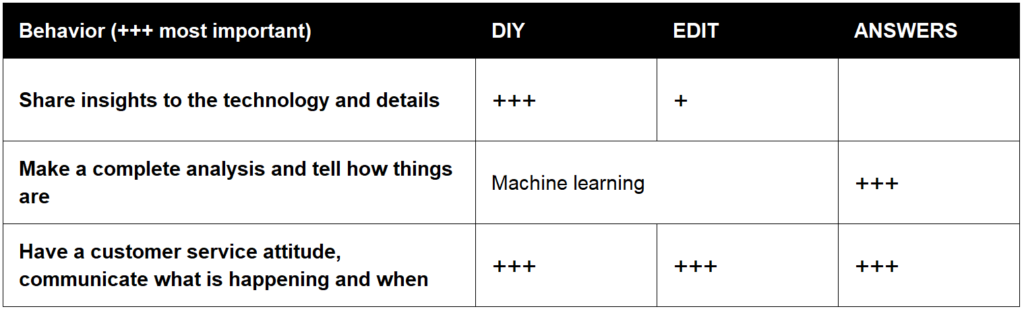
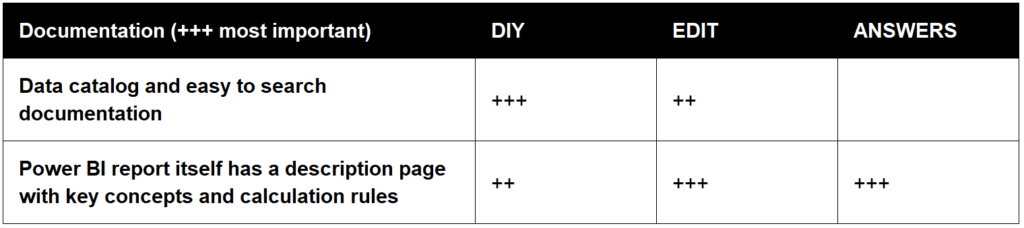
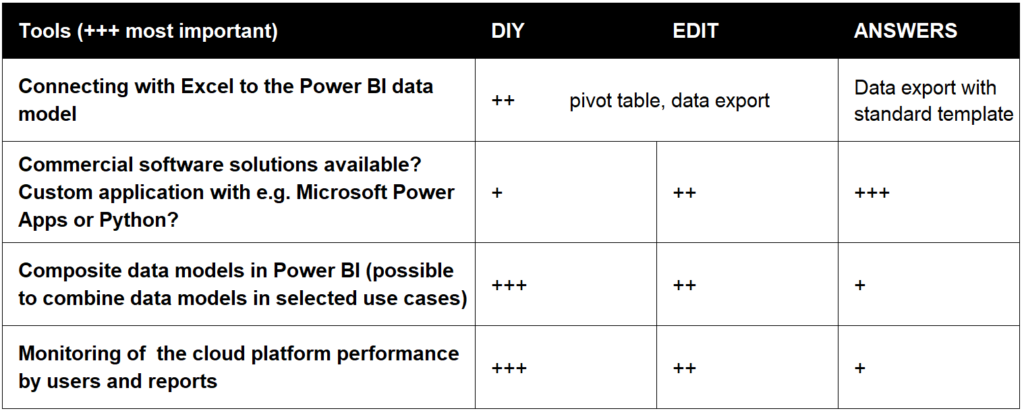
Tables on how to serve DIY, EDIT and ANSWERS groups
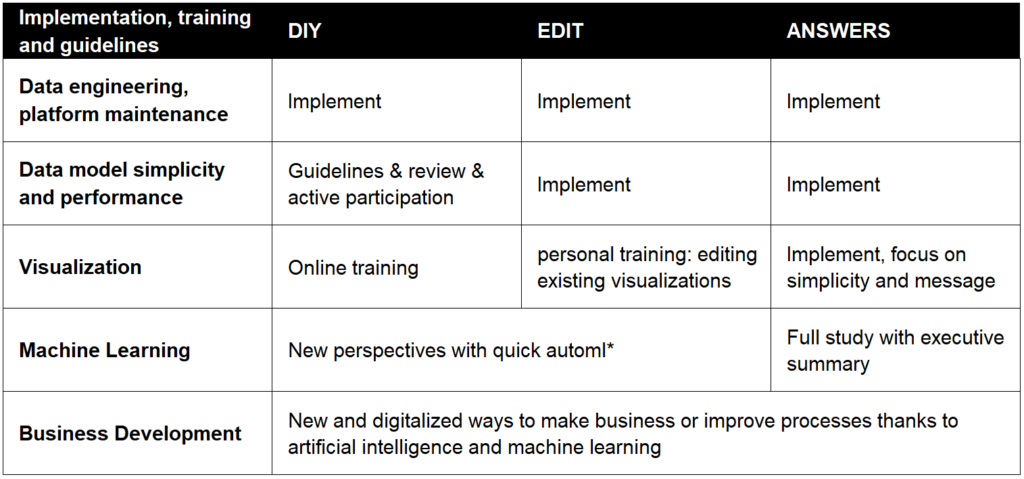
*automl = automated machine learning. Easy to use, examples include H2O automl and Azure automl, both can be used with Python (or R) or even with a graphical user interface.
For some key guidelines to data visualization see my post: Three Key Practices to Perfect Data Visualization
To learn more on data model performance in Power BI see my post: The Cost of Relationships, Snowflake vs Star Schema